

In today’s competitive digital landscape, running effective Google Ad campaigns isn’t just about throwing money at keywords and hoping for the best. It’s about making informed decisions based on concrete data. Google Ads offers a wealth of reporting tools designed to help you understand exactly how your campaigns are performing. This article will delve into the most crucial metrics you should be tracking and how to utilize Google Ads reporting tools to drive significant improvements in your return on investment (ROI). We’ll explore everything from basic performance indicators to more advanced analytics, providing you with a roadmap for data-driven campaign optimization.
Traditionally, many businesses relied on gut feeling or educated guesses when managing their advertising. However, this approach is often inefficient and costly. Data-driven decision-making, fueled by Google Ads reporting, allows you to identify what’s working, what’s not, and precisely where to focus your efforts. Instead of blindly increasing your ad spend, you can target your budget towards strategies that demonstrably deliver results. For example, imagine a small online retailer selling handmade jewelry. Without data, they might continue to spend a significant amount on keywords like “jewelry” and “earrings,” assuming they’re attracting a large audience. However, a thorough analysis of Google Ads reporting might reveal that these broad keywords are generating very low conversion rates and high cost-per-acquisition (CPA). By shifting their focus to more specific keywords like “sterling silver earrings” or “handmade gemstone necklaces,” they could dramatically improve their ROI.
Let’s examine the most important metrics you should be monitoring regularly. These metrics are categorized for clarity and provide a comprehensive view of your campaign performance.
Impressions represent the number of times your ad was shown. While it doesn’t directly translate to sales, it’s a fundamental metric. A high number of impressions indicates that your ad is being seen by a large audience. However, it’s crucial to consider the context of those impressions – are they reaching your target demographic?
Clicks are the number of times users clicked on your ad. This metric directly reflects the level of interest your ad is generating. A high click-through rate (CTR) – the percentage of impressions that result in clicks – is a strong indicator of ad relevance and quality. For instance, if your ad receives 1000 impressions and 50 clicks, your CTR is 5%. This suggests your ad copy and targeting are resonating with the audience.
As mentioned above, CTR is a critical metric. A good CTR varies depending on the industry and campaign type. Generally, a CTR above 1% is considered good, while a CTR above 5% is excellent. Continuously monitor your CTR and make adjustments to your ad copy, keywords, and targeting to improve it.
CPC represents the average amount you pay each time someone clicks on your ad. Google Ads uses an auction system to determine CPC, and factors like keyword competition and ad quality score influence the final price. Monitoring your CPC allows you to understand the efficiency of your keyword bids. If your CPC is consistently high, you might need to refine your keyword strategy or improve your ad quality score.
Conversions represent the desired actions users take after clicking on your ad – such as making a purchase, filling out a form, or downloading a resource. Tracking conversions is arguably the most important metric because it directly measures the success of your campaign in achieving your business goals. Ensure you have accurate conversion tracking set up in Google Ads and Google Analytics.
Conversion rate is the percentage of clicks that result in conversions. It’s calculated as (Number of Conversions / Number of Clicks) * 100. A high conversion rate indicates that your landing page and offer are effectively persuading visitors to take the desired action. For example, if you have 100 clicks and 5 conversions, your conversion rate is 5%.
CPA represents the average cost you pay to acquire a single customer. It’s calculated as (Total Ad Spend / Number of Conversions). Monitoring your CPA allows you to assess the profitability of your campaigns. A low CPA is desirable, but it’s essential to balance it with your conversion rate and average order value.
ROAS measures the revenue generated for every dollar spent on advertising. It’s calculated as (Revenue Generated / Total Ad Spend). ROAS is a crucial metric for evaluating the overall effectiveness of your campaigns. A positive ROAS indicates that your campaigns are generating more revenue than they cost. For example, if you spend $100 on advertising and generate $300 in revenue, your ROAS is 3.
Google Ads offers a robust suite of reporting tools to help you analyze your campaign data. Let’s explore some key features:
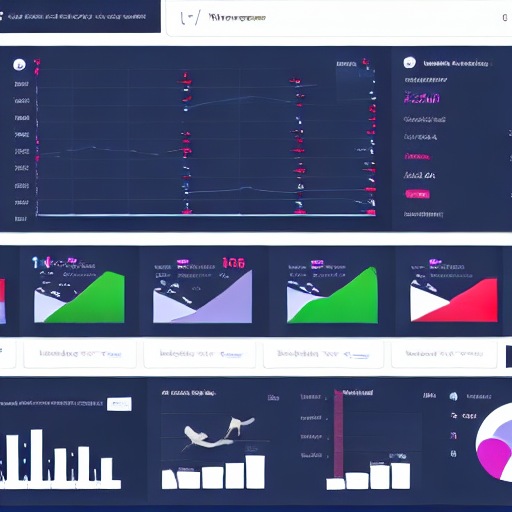
The Google Ads dashboard provides a real-time overview of your campaign performance. You can quickly see key metrics, identify trends, and drill down into specific data points. The dashboard is your central hub for monitoring your campaigns.
Google Ads allows you to create custom reports tailored to your specific needs. You can select the metrics you want to track, filter the data by date range, and export the report in various formats (e.g., CSV, PDF). This feature is invaluable for in-depth analysis and presenting your findings to stakeholders.
Google Ads allows you to segment your data by various criteria, such as device type (mobile, desktop, tablet), location, demographics, and time of day. This segmentation enables you to identify patterns and optimize your campaigns for specific user groups.
Integrating Google Ads with Google Analytics provides a more holistic view of your website traffic and user behavior. You can track conversions, analyze user journeys, and identify opportunities to improve your website’s conversion rate. Linking your Google Ads account to Google Analytics is crucial for maximizing your data insights.
Google Ads allows you to set up automated rules to respond to changes in your campaign performance. For example, you can automatically increase your bids when your conversion rate drops or pause your campaigns during periods of low traffic. Automation can save you time and ensure that your campaigns are always performing optimally.
To effectively utilize Google Ads reporting, consider the following best practices:
By effectively utilizing Google Ads reporting tools and following these best practices, you can significantly improve the performance of your campaigns and achieve your business goals.
Tags: Google Ads, Google Ads Reporting, Data-Driven Decisions, Campaign Optimization, Key Metrics, ROI, Conversion Tracking, Google Analytics, Ad Spend, Performance Analysis


0 Comments