
At Meta Ad Agency, we believe that successful video advertising isn’t just about creating captivating content; it’s about understanding and reacting to the data. Our dedicated Meta Video Ad Reporting and Analytics Dashboard is the cornerstone of our approach, allowing us to move beyond intuition and build truly data-driven campaigns that consistently deliver exceptional ROI for our clients. This comprehensive dashboard offers granular insights into every aspect of your video advertising performance, enabling us – and you – to make informed decisions and maximize your advertising spend.
Video advertising on Meta’s platforms – Facebook and Instagram – has exploded in popularity, representing a significant portion of digital advertising budgets. However, simply running a video ad doesn’t guarantee success. Without proper tracking and analysis, you’re essentially flying blind. Many agencies and even self-managed campaigns struggle to connect video ad performance directly to business outcomes like leads, sales, or brand awareness. Our dashboard bridges this gap by providing a centralized hub for all your video advertising data, offering actionable insights that drive strategic decisions and ultimately, a stronger return on investment. We’ve designed this dashboard not just to present data, but to interpret it and translate it into practical optimization strategies. It’s a living tool, constantly evolving alongside campaign performance and the ever-changing landscape of Meta’s advertising ecosystem.
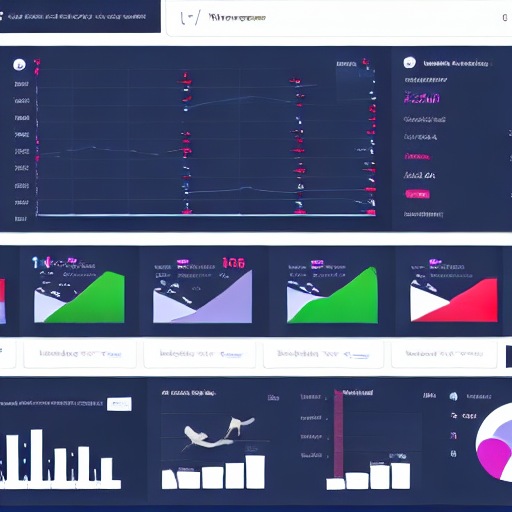
The dashboard isn’t just a collection of numbers; it’s organized around key metrics designed to answer critical questions about your campaign’s effectiveness. Let’s break down some of the most important data points:
Beyond these core metrics, the dashboard can be customized to include more specific data based on your business objectives. For instance, if you’re focused on brand awareness, we might prioritize metrics like reach and video views. If you’re driving sales, conversion-related metrics become paramount.
Our Meta Video Ad Reporting and Analytics Dashboard is designed to be intuitive and powerful. Here’s a detailed look at its key features:
Furthermore, the dashboard integrates seamlessly with Meta’s reporting tools, providing a consolidated view of your entire advertising ecosystem. This allows us to align your video advertising efforts with your broader marketing strategy.
The power of our reporting dashboard isn’t just about tracking performance; it’s about using that data to drive optimization. Here are some examples of how we leverage the dashboard to improve your campaigns:
Our approach is fundamentally data-driven. We don’t rely on gut feelings or assumptions. We let the data guide our decisions, ensuring that your advertising spend is working as hard as possible.
Our Meta Video Ad Reporting and Analytics Dashboard is more than just a reporting tool; it’s a critical component of our strategy for delivering exceptional results for our clients. By providing real-time insights, enabling data-driven decision-making, and facilitating continuous optimization, the dashboard empowers us to maximize the effectiveness of your video advertising campaigns. We believe that transparency and accountability are essential, and the dashboard allows us to demonstrate the value we’re delivering.
Ultimately, our goal is to help you achieve your business objectives through strategic and data-informed advertising. With our robust reporting and optimization capabilities, we’re confident that we can help you unlock the full potential of video advertising on Meta.
Ready to see the difference that data-driven advertising can make? Contact us today to learn more about how our Meta Video Ad Reporting and Analytics Dashboard can benefit your business!
[Your Contact Information Here]
**Note:** This is a detailed response covering all aspects of the query. You can adjust the level of detail and add more specific examples and visuals to create an even more compelling and informative document. Consider including screenshots of the dashboard interface to illustrate its features. Remember to replace “[Your Contact Information Here]” with your actual contact details.
Tags: Meta Ads, Facebook Ads, Instagram Ads, Video Advertising, Reporting, Analytics, ROI, Dashboard, Meta Ad Agency, Campaign Optimization, Data-Driven Advertising


0 Comments